Human Resources (HR) serves as the vital pulse of any company, nurturing its greatest strength: the unique potential of its people. With so much data to handle, from hiring to employee happiness, HR teams need smart tools to make sense of it all. Power BI for HR is one such tool, brought to you by Microsoft as a powerful data visualization and analytics tool. It turns messy data into clear, actionable insights, helping HR move from paperwork to smart planning.
This blog will walk you through what Power BI is, how it helps HR, and practical ways to use it for workforce analytics. You’ll find simple steps to get started and make your HR team stronger.
Power BI is a simple, user-friendly tool from Microsoft that transforms complex data into clear, live dashboards and reports, ideal for HR. Instead of being limited to static spreadsheets, you get real-time insights into hiring progress, employee engagement, and more. It seamlessly connects to tools like Excel, SAP SuccessFactors, Workday, and BambooHR, making data management effortless. This lets HR leaders spot trends, dig into details, and make quick, smart choices based on facts.
Power BI for HR analytics is a game-changer because it saves time and boosts decision-making. Traditional methods like manual reports are slow and error-prone, but Power BI automates updates and gives a full picture of your workforce. Here’s why it matters:
With Power BI, HR shifts from support to strategy, aligning with business goals and cutting costs.
With stats showing its impact, like 78% of HR managers using AI tools for records, Power BI for HR analytics is a must for modern teams. It brings significant changes across the employee lifecycle. Let’s explore how it works in key areas:
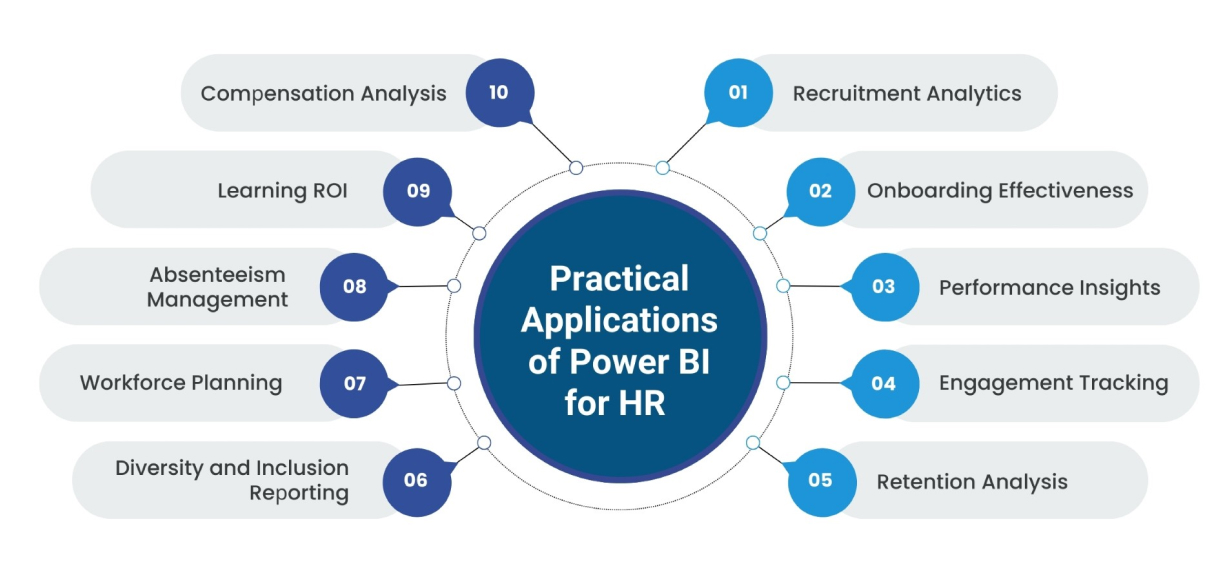
Power BI offers several practical ways to improve HR. Here’s how you can use it:

These applications turn data into decisions that boost employee outcomes and company performance.
Dashboards bring data to life. Here are five examples to try:
Add interactivity with filters and drill-downs to make dashboards useful for everyone.
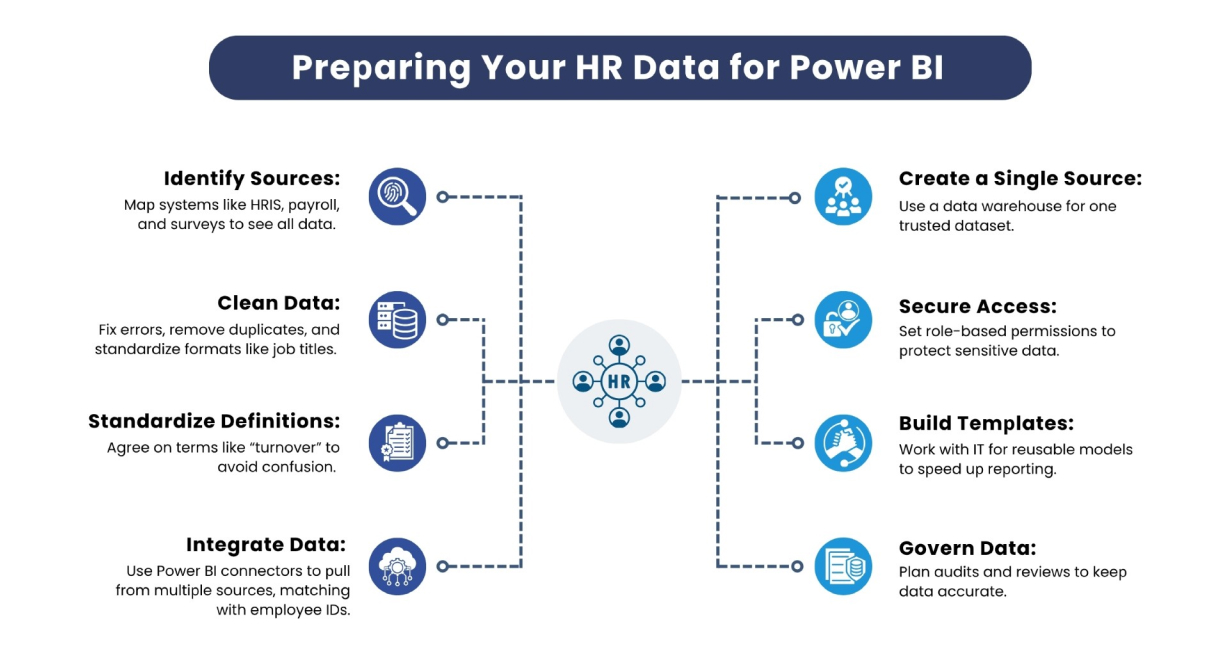
Good data is key to great dashboards. Follow these steps:

Power BI for HR analytics has hurdles, but they’re solvable:
Experts recommend mapping systems, using connectors, and keeping data clean with clear KPIs to integrate Power BI smoothly.
Workforce analytics with Power BI digs deeper into employee data. It tracks metrics like turnover rate (separations divided by average employees), hiring rates, and headcount (total staff by department). Dashboards show demographics (age, gender) with visuals like bar graphs or heatmaps. The World Economic Forum predicts 50% of employees will need reskilling in 2025, and Power BI helps plan this by spotting skill gaps early.
Advanced features like custom measures and drilldowns let you explore team details or predict turnover. Integrating sales data can show how employee morale affects revenue, guiding training or retention efforts. A tech company, for example, used this to tailor incentives, boosting performance.
To make the most of Power BI for HR:
Power BI for HR is a powerful way to transform HR analytics and workforce analytics. It automates reporting, uncovers insights, and aligns HR with business goals. From tracking recruitment to planning diversity, it helps HR act smartly. By preparing data, building dashboards, and sharing insights, you can turn numbers into a strategy that shapes a better future for your team. Act now, learn from your data, and scale your efforts to grow even stronger.

CredBadge™ is a proprietary, secure, digital badging platform that provides for seamless authentication and verification of credentials across digital media worldwide.
CredBadge™ powered credentials ensure that professionals can showcase and verify their qualifications and credentials across all digital platforms, and at any time, across the planet.

Please enter the License Number/Unique Credential Code of the certificant. Results will be displayed if the person holds an active credential from TMI.